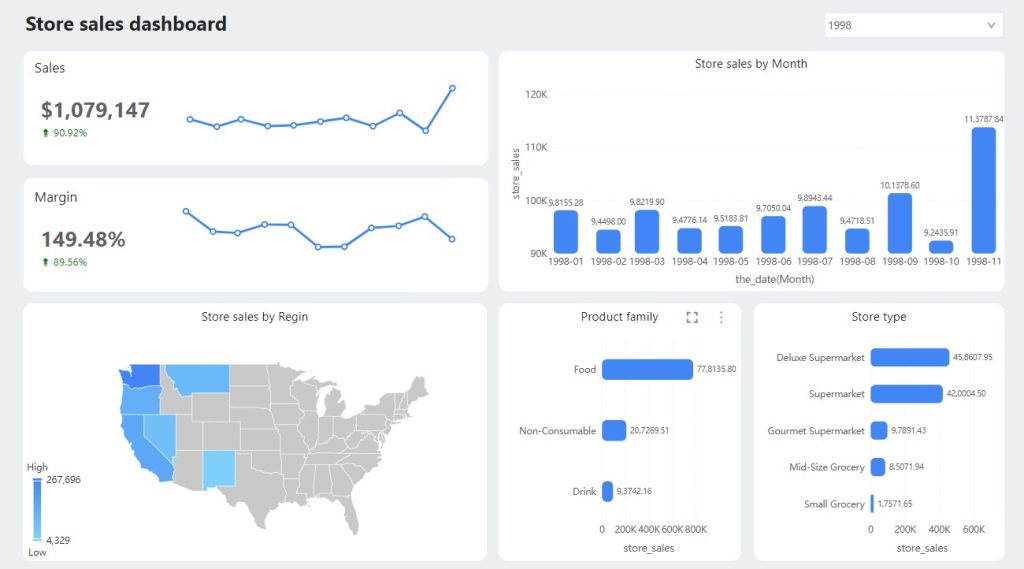
Store sales dashboard
Store sales dashboard Read More »

In this blog post, I will explain Exploratory Data Analysis (EDA) in a straightforward way and then demonstrate how to apply EDA using a spreadsheet-like visualization tool, OPTIMIBI, which was designed to help both beginners and intermediate users understand the value of EDA and how to conduct basic descriptive statistics and visual explorations. Part 1:
Exploratory Data Analysis — What It Is and Why It Matters? Read More »