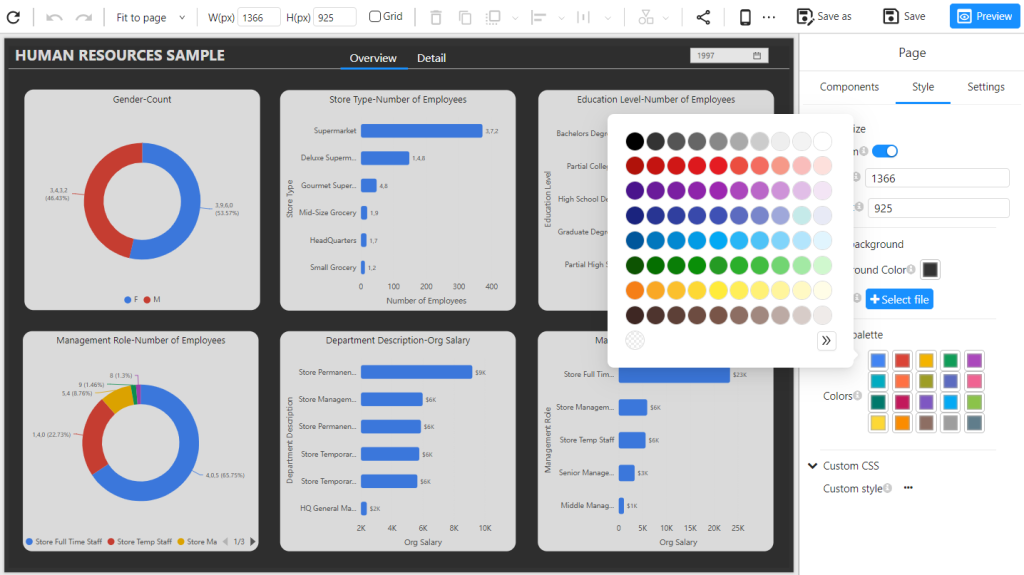
🎨 Tailor Colors, Fonts, and Styles
Customize the colors, fonts, and styles to ensure a consistent and professional appearance across all visualizations, reflecting your brand identity.
👥 Personalized Dashboards
Build tailored dashboards for various roles within your organization, ensuring that each user receives relevant and impactful insights.
🔄 Advanced Interactivity
Incorporate interactive elements for a dynamic and user-centric experience, enabling users to explore and analyze data in meaningful ways.
Access Anytime, Anywhere
📱 Effortless Dashboard Access
Easily access and interact with dashboards on any device, providing flexibility and convenience for users on the go.
🔄 Seamless Device Switching
Switch effortlessly between desktop and mobile views while designing visualizations, ensuring smooth transitions and consistent experiences.
📐 Optimal Display Across All Screens
Ensure an ideal display experience across various screen sizes, adapting your visualizations to provide clarity and readability on any device.
Built for Exploration and Decision-Making
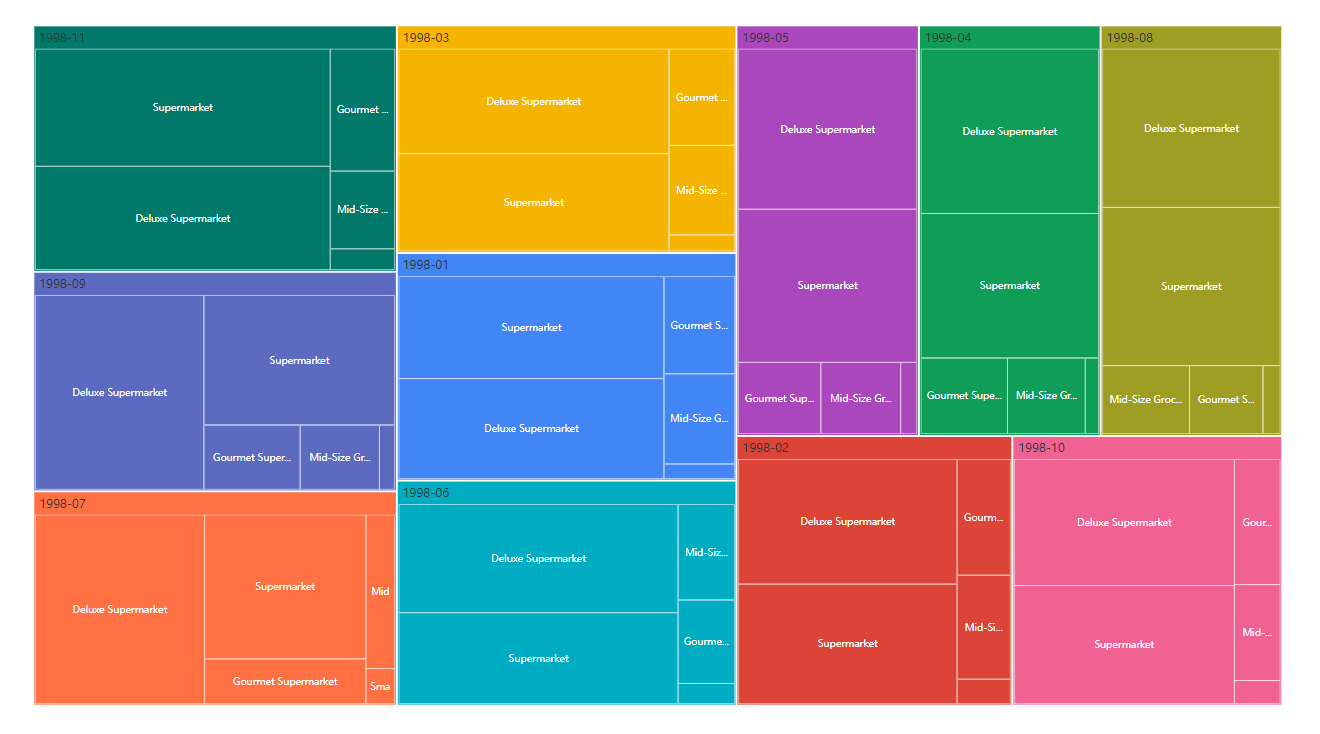
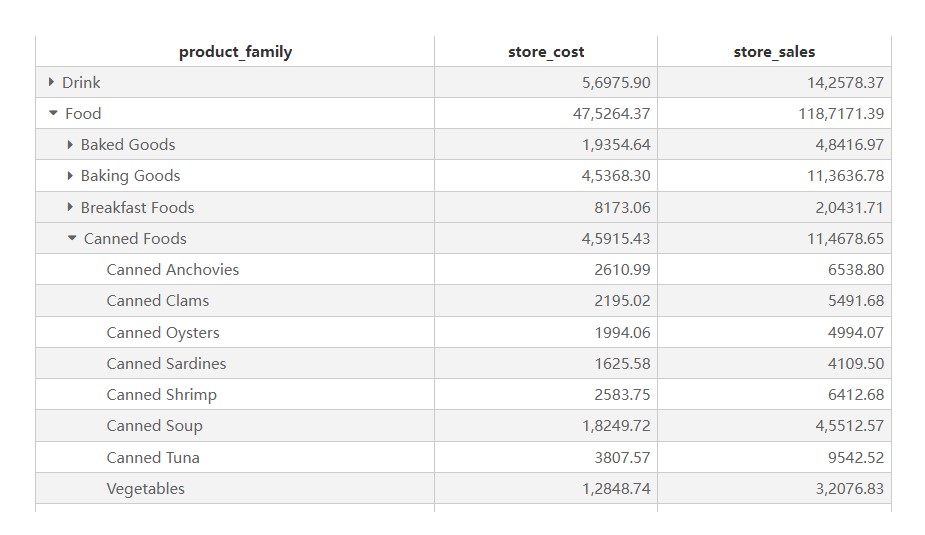
🔍 Effortless Drill-down
Allow users to drill down and navigate through layers of information seamlessly, offering in-depth exploration of data.
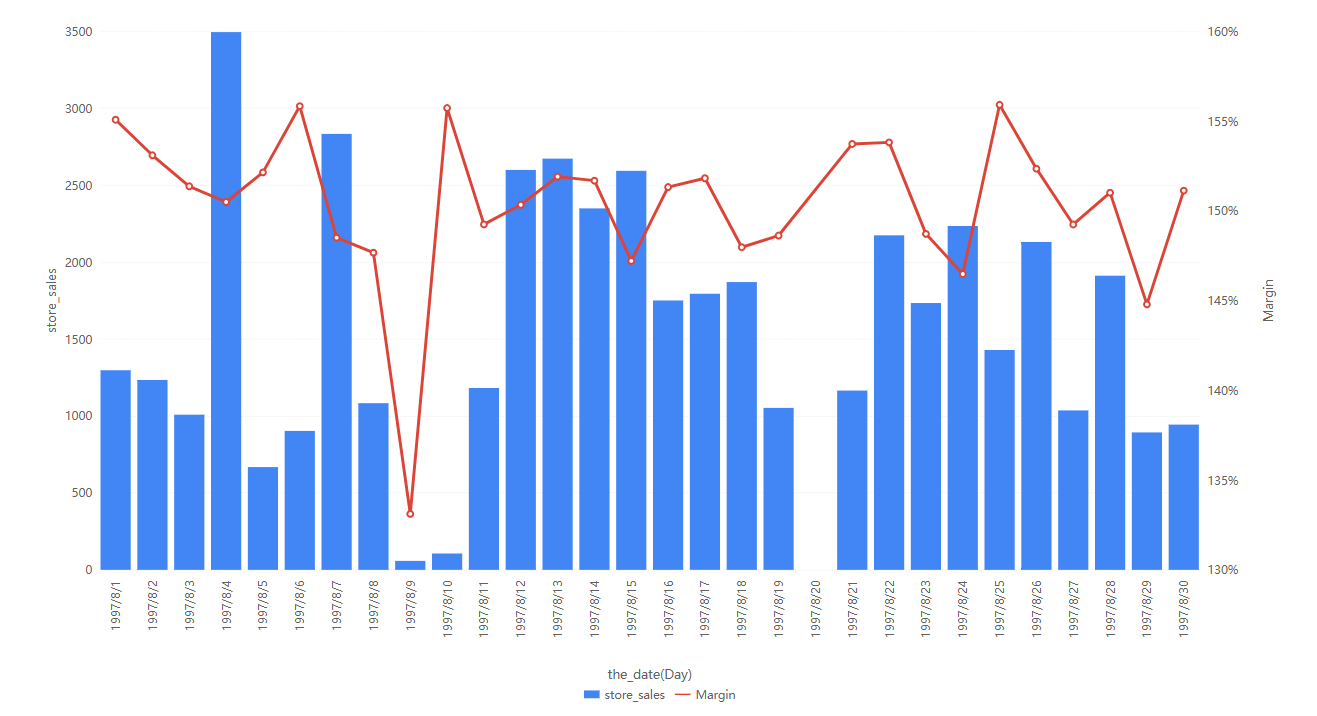
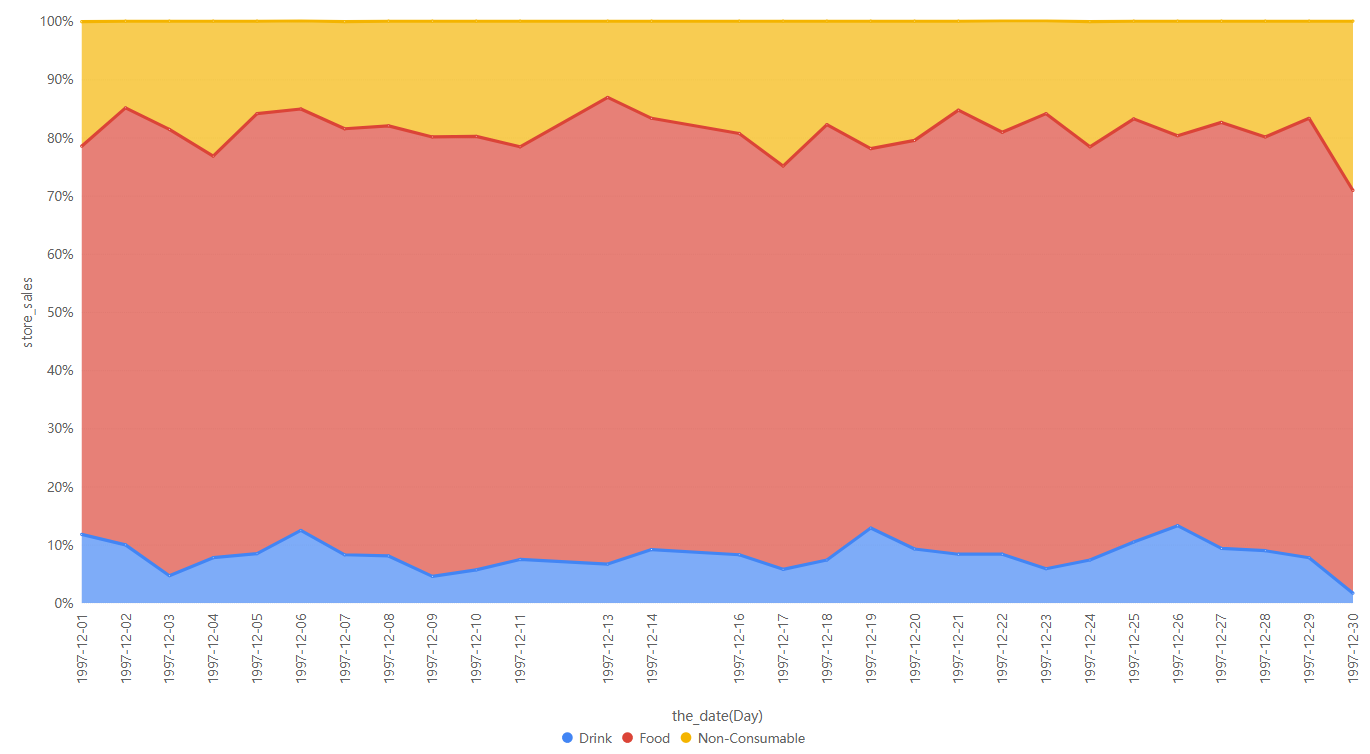
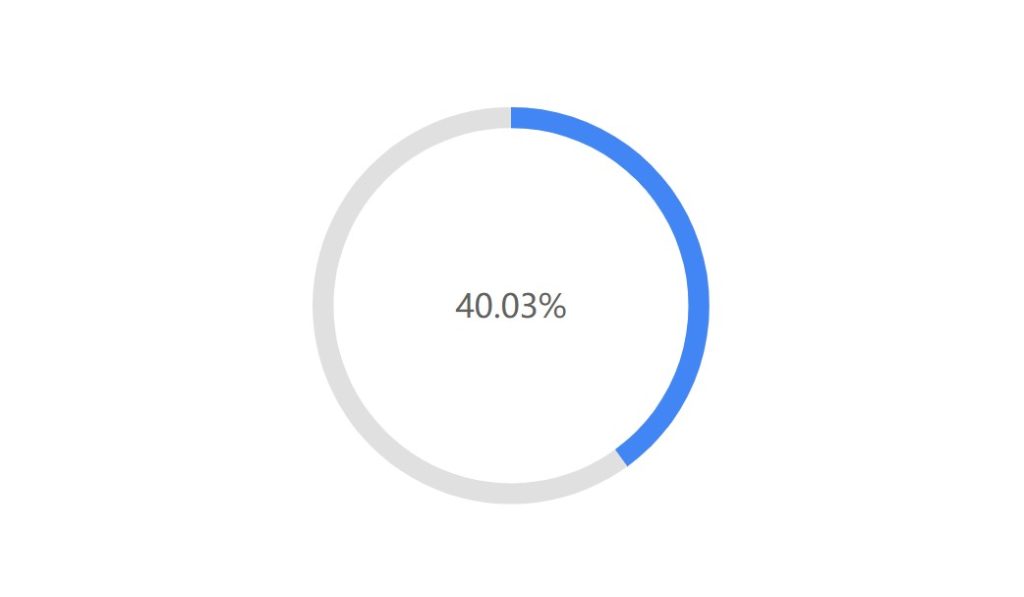
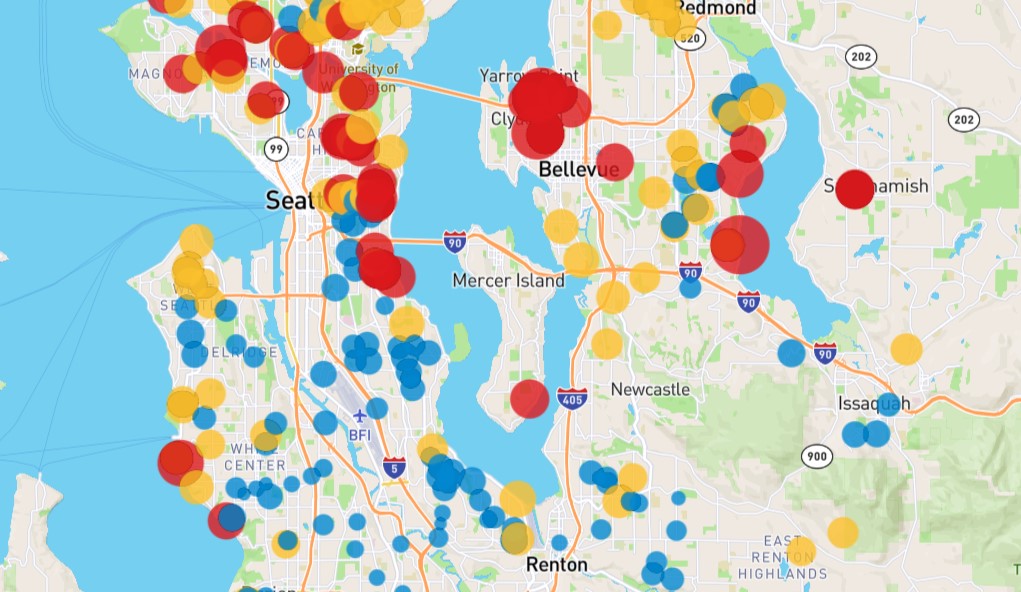
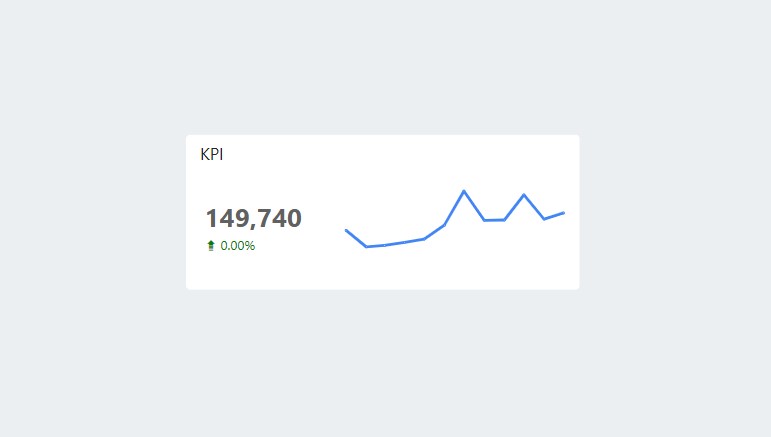
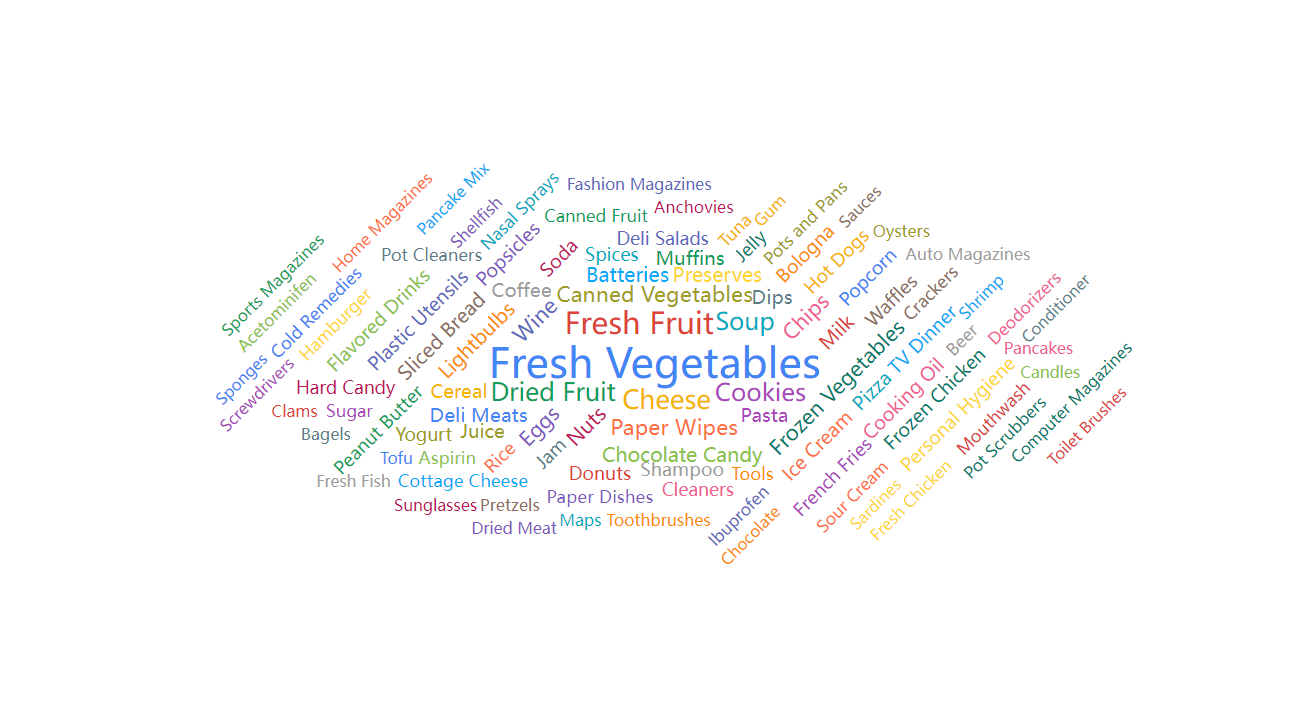
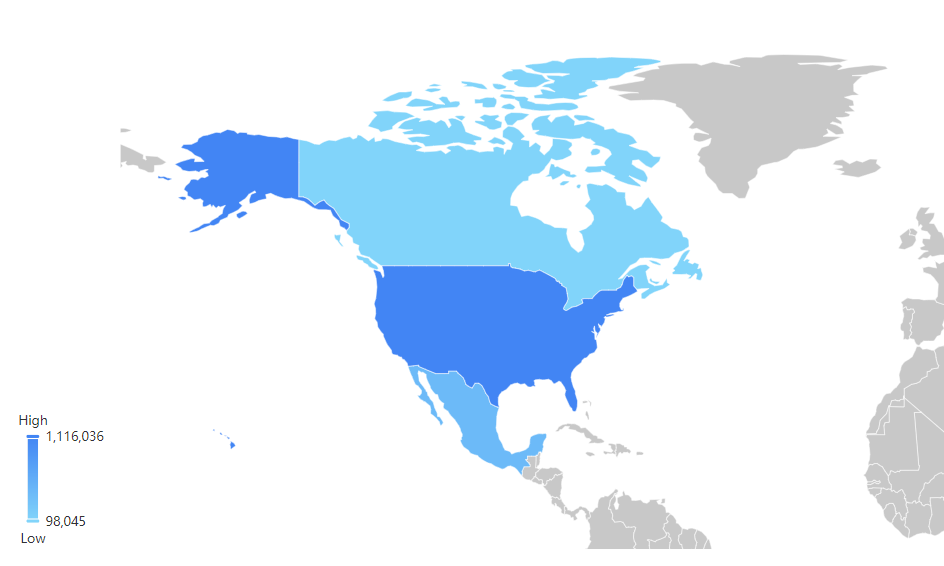
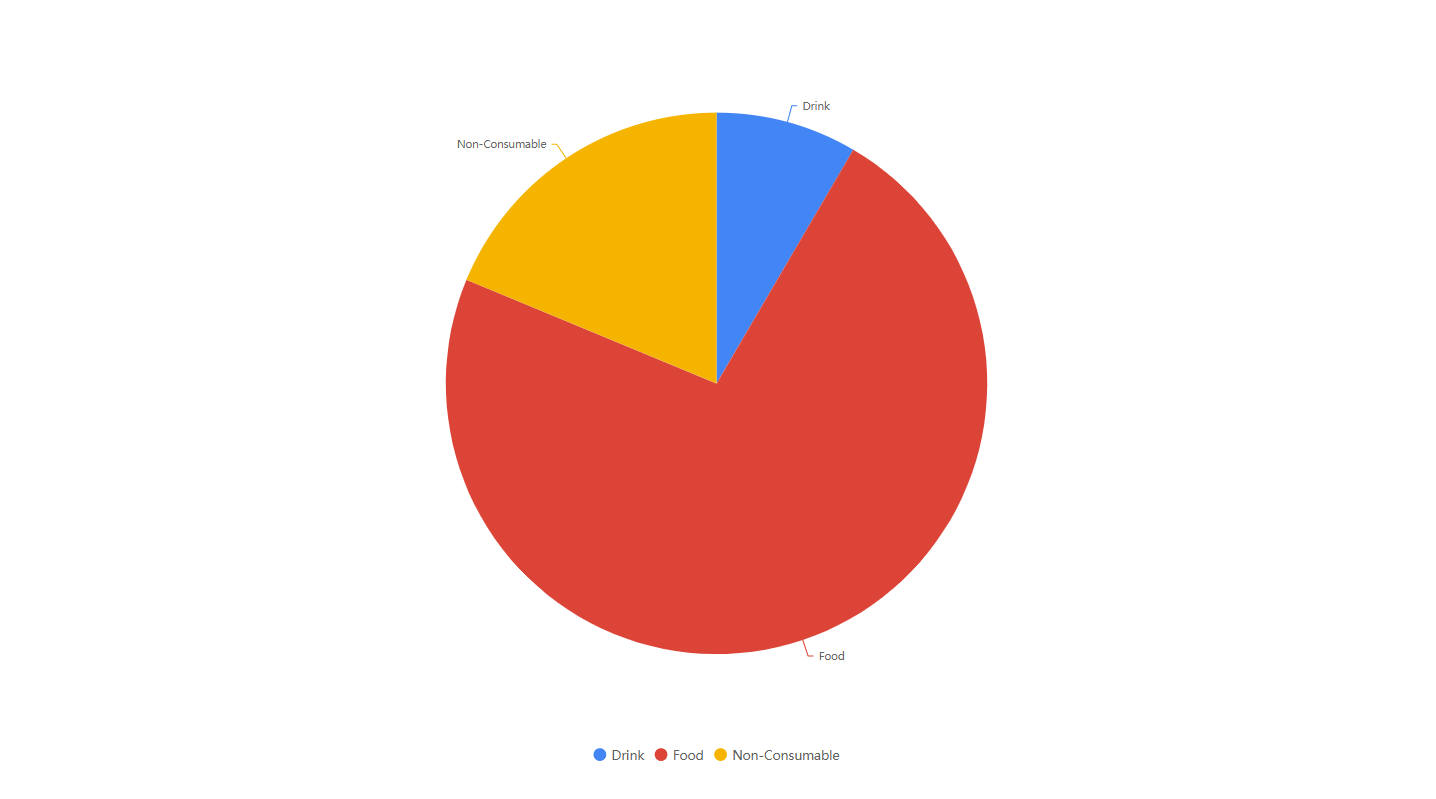
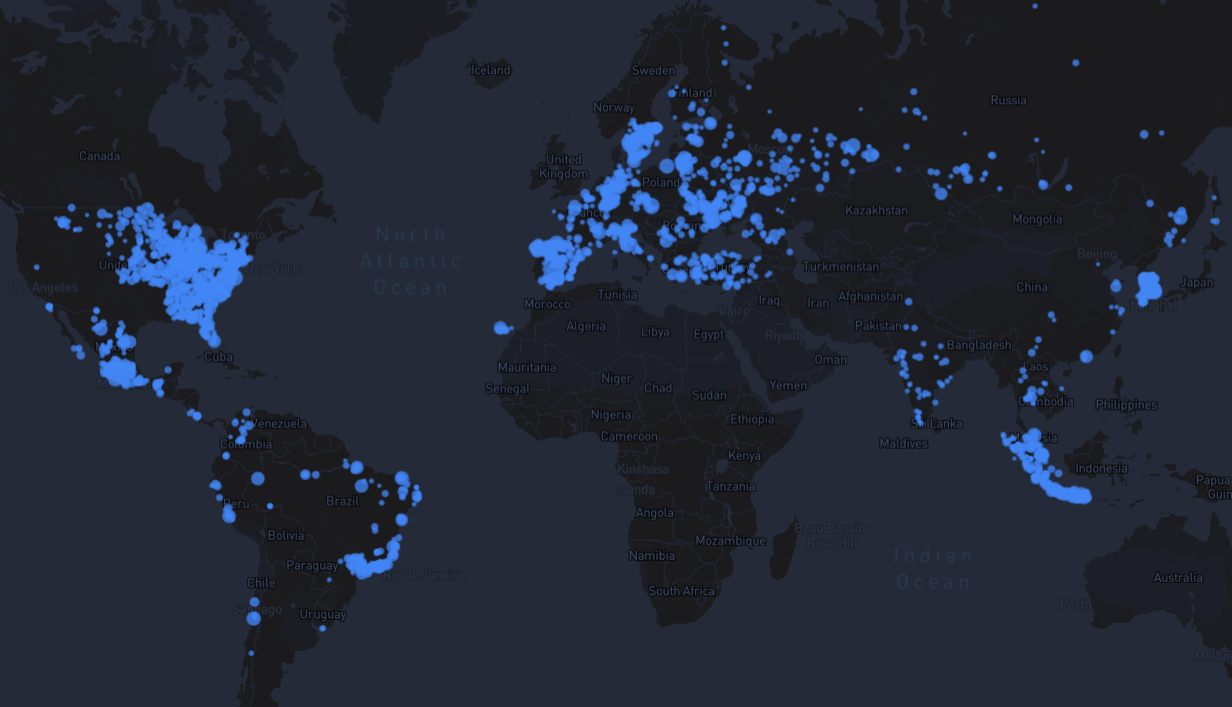
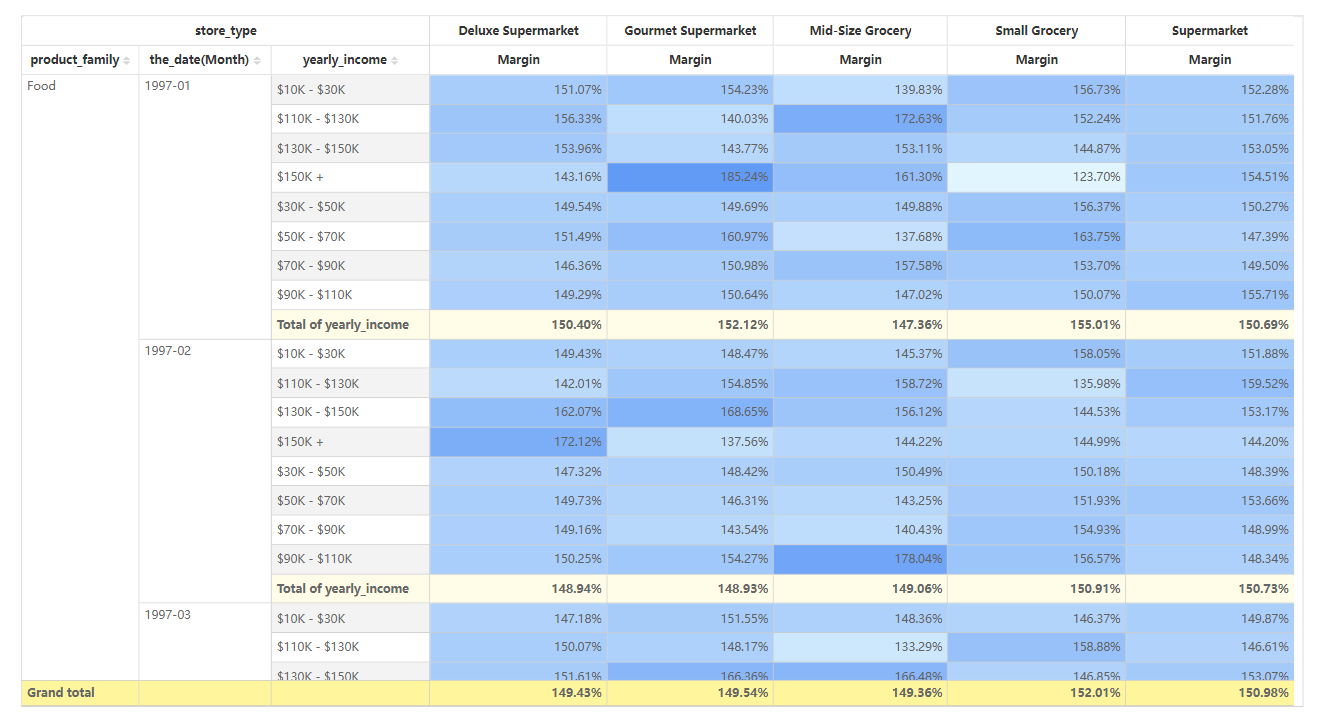
📊 Interactive Visualizations
Leverage interactive visualizations to uncover hidden patterns and correlations, enabling data-driven insights for smarter decision-making.
⏱️ Real-time Data Integration
Provide real-time updates and actionable insights with live data integration, ensuring users stay informed with the most current information.
Customized to Fit Your Unique Requirements
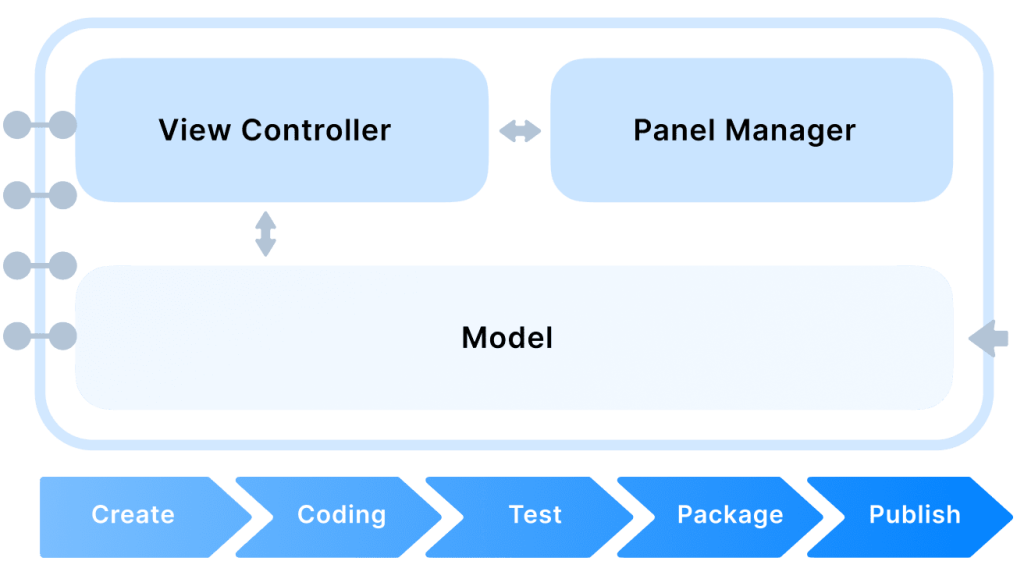
🔧 Flexibility
Seamlessly integrate third-party chart libraries like D3.js, Chart.js, and more to address advanced data visualization needs.
🎯 Specificity
Build tailor-made visualization components that align with your unique business scenarios and goals.
📈 Scalability
Easily update and extend custom visualizations to adapt to evolving business needs, ensuring long-term adaptability.
")